Why Valuation Is the Most Ignored IPO Factor
Retail investors overwhelmingly focus on GMP, subscription numbers, and brand recognition when evaluating IPOs. Valuation — whether the IPO is priced fairly relative to its earnings and peers — is rarely part of the conversation. This is precisely why many investors are caught off-guard when a well-known brand lists flat or negative despite massive oversubscription.
The P/E Ratio: Simple but Powerful
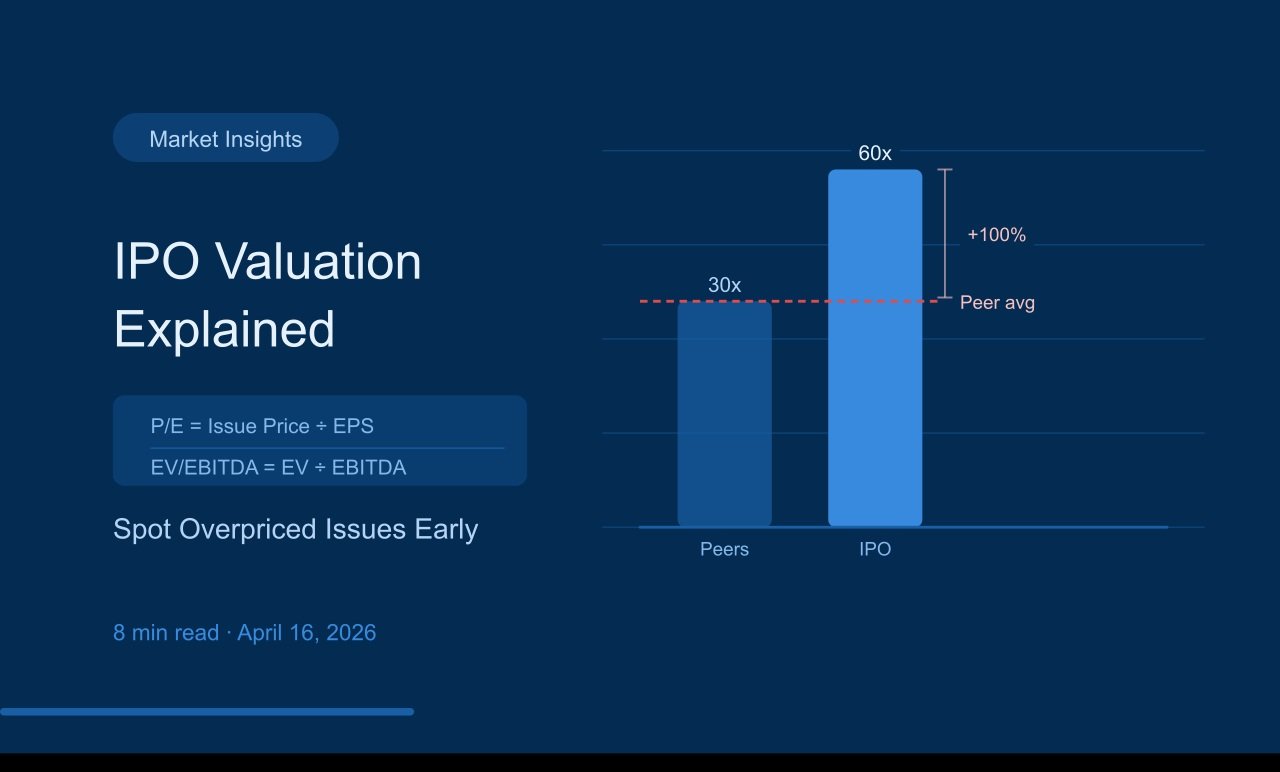
Price-to-Earnings (P/E) ratio = Issue Price ÷ Earnings Per Share (EPS). It tells you how many rupees you're paying for every rupee of earnings. A P/E of 40 means you're paying ₹40 for every ₹1 of annual profit — implying high growth expectations.
To use P/E meaningfully, compare the IPO's P/E against the average P/E of its listed peers. If the IPO is priced at 60x P/E while industry peers trade at 30–35x, you're paying a 70–100% premium. This premium needs to be justified by significantly higher growth or a materially differentiated business model.
EV/EBITDA: More Reliable for Capital-Heavy Companies
Enterprise Value to EBITDA is more useful than P/E when comparing companies with different capital structures or debt levels. It strips out the effect of taxes, depreciation, and financing — giving a cleaner picture of operational profitability.
EV = Market Cap + Debt – Cash. If two companies have similar EBITDA but one carries significant debt, their EV/EBITDA will differ even if P/E looks comparable. For manufacturing, infrastructure, and capital-intensive sectors, EV/EBITDA is often the more reliable metric.
Price-to-Sales: When Companies Aren't Yet Profitable
For loss-making companies — many tech and new-age businesses — P/E is irrelevant because there are no earnings. In these cases, Price-to-Sales (P/S) ratio is used: Market Cap ÷ Annual Revenue. Compare with industry peers. A P/S of 15x for a company growing at 25% annually is very different from a P/S of 15x for one growing at 5%.
The DRHP's Peer Comparison Table
SEBI requires every DRHP to include a peer comparison table listing the IPO company's valuation metrics alongside its listed competitors. This table is invaluable — use it. Check not just the P/E but also Return on Equity (RoE), Return on Net Worth (RoNW), and EPS growth trajectory.
What a Fair Premium Looks Like
A 20–30% premium to peer average P/E can be justified if the company has: higher growth rates, superior margin profile, stronger brand, or a market leadership position. A 100%+ premium to peers is rarely justified and often signals that post-listing correction is likely as institutional investors take profit.
Putting It Together
Combine valuation analysis with subscription data and GMP for a complete picture: a fairly valued company with 25x QIB subscription and a moderate positive GMP is a far stronger candidate than an overvalued one with high retail GMP driven by social media hype.